| |
Housing Credit Led Growth in India during the Period 2000-2012*
Dr S.S. Sangwan
December 01, 2013 | Dr S.S. Sangwan Web Exclusives, Dr S.S. Sangwan, Dr S.S. Sangwan, Bank Credit
An Abstract
The contribution of housing & construction sector in the GDP of India has almost doubled during 2000-2011 with synchronisation in growth rates of the two. The modern housing in India has mainly been confined to urban areas as revealed by census. The policy changes since 1998 with rebate on interest and repayment of principal of housing loans. As a result , the share of credit for housing in GDP increased from 2 % as on March in 2000 to about 8% as on 2008 and thereafter. The comparison between the annual growth rates of housing loans from SCBs and GDP clearly depicts the former as a pull factor for the growth of the economy during the study period.
But this impressive growth of housing sector through housing loans has excluded EWS and those working in unorganised sectors due to lack of security with them while the upper and middle classes are taking undue advantage of loans and purchasing houses for speculative purpose. This process has increased the prices of housing in view expected high prices and it has made the houses inaccessible to weaker sections. That may be reason that in the requirement of 18.7 mn housing units in urban areas during 2012-17, 18. 5 million is for EWS/LIG and 40 million units are required in rural areas. The PURA model with some modifications on the lines some international experience is suggested as an approach to make houses affordable and accessible to EWS.
Housing Credit Led Growth in India 2000-2012*
Housing is the second largest generator of employment in India, next only to agriculture. Recognising housing as one of the basic necessities, United Nations General Assembly adopted a resolutions in May 1987 “callsing upon all States and international organizations concerned to pay special attention to the realization of the right to adequate housing in carrying out measures to develop national shelter strategies and settlement improvement programmes within the framework of the global strategy for shelter”. Government of India (GOI) had announced its first National Housing Policy (NHP) in 1988 with goal of “Eradicating houselessness by 2001”. Prior to this, the main focus of housing development in India was on construction of houses for government employees with funds from governments and government owned companies. The Indira Awaas Yojana was only scheme since 1985 for families below poverty line which involved a little subsidy and small loan amount from the banks. The NHP of India was revised in 1992, 1994, 1998, 2005 and 2007.The initial three housing policies were just statement of objectives and it was in 1994 when Government’s role was adopted shifted from builder to facilitator of housing activities and this approach was further specified in National Housing and Habitat Policy (NHHP) 1998 by announcing construction of two million additional housing units, annually in the public private participation mode. As a follow up to NHHP 1998, GOI has offered fiscal and monetary concessions to involve the private sector and encourage individuals for investment in housing.
Contribution Housing in GDP
Since 1998, the housing sector has attracted huge investment especially through bank credit and consequently, the contribution of real estate, dwellings & business services and construction activity in the gross domestic product (GDP) has increased from 9.6 per cent in 1999-2000 to 19.0 per cent in 2011-12 as given in Table-1. This paper attempts to analyse the impact of policy changes since NHHP 1998 which gave a boost to flow of bank credit for housing and construction activities. The analysis aims to establish that the unprecedented bank credit was main driver of housing sector development in India and the later in turn, was the main push factor for the overall higher growth rate of its GDP.
Table-1:Employment, Production and Sales in KVIs in India (1994-95 to 2010-11)
Year
Sector |
1993
-94 |
1999
-2000 |
2001
-02 |
2005
-06 |
2006
-07 |
2007
-08 |
2008
-09 |
2009
-10 |
2010-11 |
2011-12 |
1.Housing,Real Estate & Busi-ness Services |
5.64
(2.8) |
4.54
(2.9) |
8.7
(7.5) |
9.1
(10.6) |
9.3
(9.5) |
9.6
(8.4) |
10.3
(10.4) |
10.4
(8.3) |
10.4
(6.0) |
10.8
(10.3) |
2.Construction |
5.2
(5.5) |
5.1
(8.1) |
6.0
(6.4) |
7.9
(12.8) |
8.2
(10.3) |
8.5
(10.8) |
8.5
(5.3) |
8.2
(6.7) |
8.2
(10.2) |
8.2
(5.6) |
Total (1+2) |
10.8
(4.1) |
9.6
(4.5) |
14.7
(5.2) |
17.0
(8.7) |
17.5
(12.8) |
18.1
(13.1) |
18.8
(10.8) |
18.6
(7.2) |
18.6
(8.3) |
19.0
(8.7) |
GDP Growth Rate |
5.7 |
7.6 |
4.3 |
9.5 |
9.6 |
9.3 |
6.7 |
8.4 |
8.4 |
6.2 |
Notes:
1.Shares in current prices and growth rates in brackets are in constant prices.
2. From 2001-02 business services related to housing are included in Housing itself.
Source : National Accounts Statistics and Economic Surveys of various years , GOI
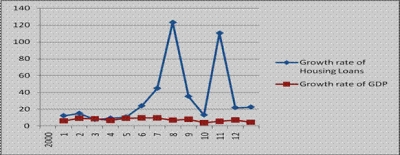
Table-1 shows that the share of housing, real estate and business services increased from 2.9% in 1999-2000 to 10.3 % in 2011-12. Besides, the construction industry has also increased its share from 5.1 % to 8.2% during the above period. Their combined share in GDP was hovering around 10 % during decade of 1990s but after 1999-2000, the share continuously increased to a level of 19% in 2011-12. Housing activities have both forward and backward linkages with a large number of sub-sectors such as steel, cement, builders’ hardware, paints, electrical, transport, electricity, gas, water supply, etc which contribute to capital formation, income opportunities, and generation of employment (Economic Survey , GOI, 2012-13). Hence, construction with the maximum income multiplier can activate the economy as a whole. The figure-1 indicates broad synchronisation between growth rate of housing and growth rate of GDP. During the boom period 2005-2008 of housing development, the GDP growth rate was between 9 to 10 per cent which is the highest growth rate in the history of India.
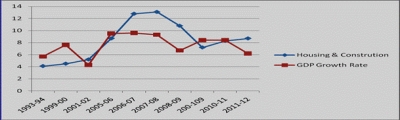
Figure 1: Growth rates of Housing sector and GDP
Policy Changes for Housing since 2000
As a follow up to NHHP 1998, GOI has announced the following fiscal, monetary and other measures to encourage investment in housing and flow of funds from banks and Housing Finance Companies (HFCs).
The Act of National Housing Bank (NHB) which was providing refinance for housing since 1987 was amended in 1999-2000 to simplify the existing provisions regarding foreclosure and transfer of property. It has resulted in registration of 251 institutions, including 46 Commercial Banks, 64 Regional Rural Banks (RRBs), 24 Foreign Banks, 58 Co-Operative Banks and 59 Housing Development Companies with NHB as on as on 30 June 2012. The income by way of interest on bad & doubtful debts of HFCs registered with NHB was made chargeable to tax in the year in which it is actually received by the HFC. The interest on borrowed capital after April 1999 for acquisition or construction of residential unit was allowed to be deducted from income tax to a certain limit since 1998 and it is Rs 1, 50,000 per annum per individual since 2002. Besides, the principal repayment of home loan upto Rs100000 lakh can also be deducted from income. Repeal of the Urban Land (Ceiling and Regulation) Act in as many as 9 states of India. The earlier rent control laws were repealed in 12 states with enactment of more balanced rent laws to encourage more investment in housing and construction. The depreciation rate on new dwelling units purchased by the corporate sector for its employees was increased from 20 % to 40 % since 1999. A provision was made to accord tax-free status in respect of limited amount of bonds issued by Municipal bodies every year. The Two Million Housing Programme was launched in 1998-99 which was a loan based Scheme and seeks to facilitate the construction of two million additional houses per annum of which 0.7 million are targeted in urban areas and 1.3 mn in rural areas. In order to enhance the flow of credit to the housing sector, the Reserve Bank of India (RBI) advised the Scheduled Commercial Banks (SCBs) to lend up to 3% of their incremental deposits for housing finance in 2002-03 as against 1.5% in the previous year and this condition was further relaxed to the wisdom of banks after 2002-03. The refinance norms for housing loans were liberalized by NHB, resulting in increase of its refinance from Rs 10030 million during 2000-01 to Rs 143910 million in 2011-12. Even the National Bank for Agriculture and Rural Development (NABARD) which was not refinancing Hhousing loans till 1998-99, has given refinance of Rs 345450 million under NFS and out of which about 1/3rd is for housing sector in rural areas. With a view to generate economic activity and , create new employment opportunities, GOI decided to allow FDI up to 100% in 2005 under the automatic route in housing and construction development projects (Press Note No. 2, 2005 Series and Indian FDI). The limit of housing loan under priory sector was enhanced frequently since 2000 which is Rs 2.5 million at present. Interest rate was decontrolled by RBI which slipped to as low as 6% in 2006-07 and the limit to financing housing were also increased over time. The policy of Special Economic Zones (SEZs) since 2000 resulted in purchase of big chunks of land by the Corporate sector for commercial and real estate developers around SEZs. To improve the affordability of housing loans by economically weaker sections(EWS) in urban areas, GOI introduced ‘Interest Subsidy’ for Housing the Urban Poor (ISHUP) since December, 2008 with interest subsidy of 5 per cent per annum for whole duration of the loan (15-20 years) for loans up to Rs 0.1 million extended by Banks and select HFCs. To stimulate demand for credit for housing in the middle & lower income segments, 1 per cent Interest subsidy for Individual housing loans up to Rs 1.5 million and cost of the unit upto Rs 2.5 million was introduced by GOI from 1st October, 2009. Recently, GOI has set up the Credit Risk Guarantee Fund Trust for Low Income Housing on 1st May, 2012. The fund will provide credit risk guarantee to the lending institutions against their housing loans up to Rs 5 lakh for new borrowers in the EWS categories to do away with requirement of any collateral security and/or third party guarantee. Provision of deduction of 30% of the rent from rental income for income tax purpose to encourage house construction for rent.
Drivers of Housing Development
a. Foreign Direct Investment
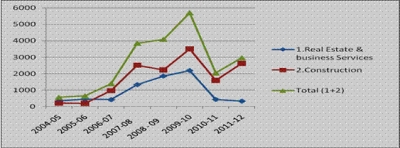
The permission of 100% FDI in reality sector in June 2005 resulted in inflow of total US $21860 millions in this sector during the period 2004-05 to 2011-12 which is almost 22% of total FDI (Table-2). Within the sector, the FDI in construction has recorded much high increase than real sector. After the policy decision, the flow for FDI for real estate and construction has more than doubled in 2006-07 itself with a peak of US$5706 in 2009-10.
Table-2: FDI Inflow in Real Estate & Construction (in US $ Million)
Year/Period |
2004
05 |
2005-06 |
2006-07 |
2007-08 |
2008 - 09 |
2009-10 |
2010-11 |
2011-12 |
Cumulative 2005-06 to 2011-12 |
1.Real Estate & business Services |
363 |
452 |
431 |
1336 |
1856 |
2191 |
444 |
340 |
7776 |
2.Construction |
209 |
191 |
968 |
2521 |
2237 |
3516 |
1599 |
2634 |
14084 |
Total (1+2) |
572 |
643 |
1399 |
3857 |
4093 |
5707 |
2043 |
2974 |
21860 |
Total FDI |
2320 |
3359 |
9307 |
19425 |
22697 |
22461 |
14939 |
23473 |
99901 |
Source: RBI Annual Reports of Various years
However, the FDI started declining after 2010 which reflect the slowdown in this sector in India. The trend in the flow of FDI in housing is also depicted in figure-2.
b. Housing loans
The availability of loans from banks and the Housing Development Companies (HDCs) may be main deriver for the unprecedented growth during 2000-2012.The structure of credit for housing loans in India consists of apex level refinance institutes like NHB and NABARD as mentioned earlier. The primary lending agencies for Housing loans are SCBs including RRBs and cooperative banks. Besides, the public sector HFCs like Housing and Urban Developed Corporation (HUDCO) & Life Insurance Corporation (LIC) of India are financing for housing since 1970s. After 1990, the Bank sponsored & private housing companies are also financing for housing loans. These agencies are financing to individuals, housing boards, and other public and private housing intermediary agencies for construction of houses and acquiring of land/plots for constructing houses (RBI, 2012). The share of HFCs was more in the housing loans till 2000 but SCB share started increasing thereafter due to fiscal incentives as stated earlier. The shares of these two main agencies in the outstanding housing loans are shown in Table- 3 at four points of time since 2000.
Table-3: Outstanding Housing Loans of SCBs and HFCs as on March 31
(Amount in $ Billion)
Lending Institutions |
2000 |
%age
share |
2005 |
%age share |
2008 |
%age share |
2012 |
%age share |
Scheduled Com- mercial banks |
147 |
36.75 |
1287
(155.10) |
72.55 |
2557
(32.89) |
70.07 |
3880
(12.94) |
63.58 |
Housing finance companies |
253 |
63.25 |
705
35.73) |
27.44 |
1092
(18.30) |
29.92 |
2222
(25.87) |
36.41 |
Total |
400 |
100 |
1992
(79.60) |
100.00 |
3649
(27.73) |
100.00 |
6102(16.81) |
100.00 |
Housing loan as % to GDP |
2.17 |
|
6.70 |
|
7.96 |
|
7.30 |
-- |
Source: RBI- Report on Trend and Progress of Housing in India and Annual Reports of RBI.
Notes: 1.Figures in brackets are annual percentage change during the above periods.
2. The GDP has been taken at current prices.
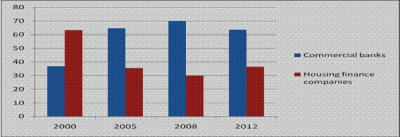
The Table-3 shows the share of SCBs in the outstanding housing loans was 36.75 % as on March 2000 which increased to 63.58 % as on March 2012 while the share of HFCs declined from 63.25 % to 36.41% during this period due to liberal financing for housing by banks. During the above sub-periods, the maximum growth was during 2000 to 2005 due to immediate impact of fiscal and monetary incentives given since 1998-99. The incentives were favourable to housing loans from both SCBs and HFCs but the growth rate housing loans from CBs was much higher which may be due to convenience of bank loans and lower interest rate. The shares of SCB and HFC in housing loans are also depicted in Figure-3.
The share of housing loans in GDP of the country increased from 2.17 % in 2000 to the maximum 7.96 % in 2008 which moderated to 7.30 % in 2012. It is to be noted that these housing loans do not include the loans given by cooperatives and employers to their employees which may further increase the share of housing finance in GDP. This four to five times increase in housing loans not only gave a big push to housing development but may acted as engine of growth for the economy as a whole.
c. Trend in Housing loans of Scheduled Commercial Banks
The year-wise outstanding housing loans since 1999-2000 along with their share in total bank credit and in priority sector is given in Table-4. The share of housing loans in total outstanding bank credit has increased from 3.37 % in 2000 to the maximum 12.89 % as on March 2006 when the rate of interest on housing loans was also at its lowest level and cumulative effect of policies was in full swing. The housing loans in priority sector (PS) were also made liberal by increasing the limit from time to time. The share PS housing loans in total PS loans increased from 10.7 % in 1999-2000 (column 7 of table-4) to the maximum 26.1 % as on March 2006 and but it also declined to 18.0 % as March 2102. The share of PS housing loans in the total housing loans was 96% in 1999-2000 but its share got reduced after to 65 % as on March 2012 (column 5). The absolute amount of PS housing loans was increasing continuously but it could not keep pace with much higher increase in the housing loans outside the PS. It means the decontrol of interest rate and tax incentives induced higher increase in housing loan outside the PS housing loans. If loans for construction are also included then the share of housing sector increases to about 14 % as on March 2006 (column 9) which moderated to 12 % in 2008-09 and declined to 10 % as on March 2012.
Table-4: Share of Housing Loans in Total Bank credit and in PS loans by SCBs
Year |
Housing Including PS Housing |
Housing as % of Total Loan |
Growth rate of Housing loan (%) |
PS Housing loan as % of total H.Loans |
Housing loans as % of total PS Loans |
Construction loans |
HL+const
ruction as % of total |
Annual growth rate of GDP at 2004-05 prices. |
1 |
2 |
3 |
4 |
5 |
7 |
8 |
9 |
10 |
2011-12 |
3880 |
8.88 |
12.11 |
65.08 |
18.04 |
567 |
10.17 |
6.2 |
2010-11 |
3461 |
9.28 |
15.02 |
66.66 |
18.61 |
501 |
10.62 |
9.3 |
2009-10 |
3009 |
9.74 |
7.70 |
72.42 |
19.95 |
442 |
11.17 |
8.6 |
2008-09 |
2794 |
10.55 |
9.27 |
70.54 |
21.14 |
385 |
12.01 |
6.7 |
2007-08 |
2557 |
11.38 |
10.69 |
71.41 |
24.72 |
279 |
12.62 |
9.3 |
2006-07 |
2,310 |
12.50 |
23.93 |
69.39 |
25.28 |
200 |
13.58 |
9.6 |
2005-06 |
1864 |
12.89 |
44.83 |
71.46 |
26.08 |
133 |
13.81 |
9.5 |
2004-05 |
1287 |
12.36 |
123.44 |
70.16 |
23.67 |
83 |
13.16 |
7.0 |
2003-04 |
576 |
7.54 |
35.21 |
90.28 |
19.71 |
60 |
8.32 |
8.1 |
2002-03 |
426 |
6.36 |
13.00 |
85.68 |
17.25 |
49 |
7.09 |
4.0 |
2001-02 |
377 |
7.02 |
110.61 |
70.29 |
13.00 |
40 |
7.77 |
5.5 |
2000-01 |
179 |
3.82 |
21.77 |
89.94 |
10.46 |
32 |
4.50 |
7.3 |
1999-00 |
147 |
3.67 |
22.50 |
95.92 |
10.70 |
28 |
4.37 |
4.6 |
Average |
1759 |
8.92 |
34.62 |
76.10 |
19.12 |
215.31 |
9.94 |
7.36 |
Source : Annual Report of RBI, Various years, Data are provisional and relate to select banks which cover 95% of total direct credit extended by all SCBs ; Note: Hl= Housing Loan, PS= Priority sector
The annual growth rate of housing loan in column 10 of Table-5 has taken an inverted U shape and it is still positive. The line graph (in figure-3) between the growth rates of housing loans and the GDP also shows that the former may be one of the pull factors in the growth rate of total economy during 2000-2012. However, there may be time lag in the impact of housing loan on GDP as the correlation was positive to the extent of 0.4% when one year lagged growth rate of housing loan was taken with the current year GDP.
Status of Households, Census Houses and Population
There has been gap between demand and supply of houses (Census 1991, NHB 1999 and Working Groups for 11th &12th FYPs) but there were certain path breaking policies favourable to housing development after 1998 NHHP which have brought a boom like situation especially in urban housing. The decadal growth during the Census 2001 and 2011 of number of households, the census houses and population in India is given in Table-5.
Segment |
Population |
Census Houses |
No of Households |
2001 |
2011 |
2001 |
2011 |
2001 |
2011 |
Rural |
742 (18.0) |
833
(12.26) |
177.54
(24.2) |
220.70
(24.31) |
138.27
(20.7) |
167.83
(21.38) |
Urban |
285
( 31.0) |
377
(32.28) |
71.56
( 37.5) |
110.14
(53.91) |
53.69
(36.0) |
78.86
(46.90) |
Total |
1027
(21.4) |
1210
(19.01) |
249.10
(27.7) |
330.84
(42.57) |
191.96 (27.1) |
246.69
(28.51) |
Source: Census of India 2011- Household Amenities and Assets. Census Houses include other than residential houses too. Figures in Brackets are percentage decadal growth.
The growth of all households (HHs) during 2001-2011 is about 29 % as compared to 27 % during 1991-2001 as shown in last cells of Table- 5. There was in addition of to total of about 55 million HHs during the decade and out them increase was 25 million in urban areas with growth of about 47 % as against 30 million in rural areas with growth rate of 21 %. The growth rate of urban HHs is about 11 percentage point higher during 2001-11 compared to during 1991-2001 while growth rate was almost same of rural HHs.
The census houses, including other than residential houses have also recorded the maximum growth of about 54 % in urban areras as compared 24 % in rural areas which are much more than earlier decade, thus confirming the impact of fiscal incentives since 2002 . It clearly brings out that housing development is mainly in urban areas. It may be noted that urban houses are mainly of burnt bricks and cement which have much higher income multiplier which lend support to our hypothesis that housing development may have been pulled up the growth rate of overall GDP.
In spite of the unprecedented increase in houses especially in urban areas during 2001-2011, the technical committee on urban housing for 12th Five Year Plan (2012-17) has estimated requirement of 18.8 million units of which 18.5 million for EWS. In Table-5 too, the residential houses are about 60 % of total 110 mn i.e. 66 mn and there is a continuous addition to urban HHs due to migration especially the left out Low income families, hence, it lends support to the estimate. Besides, the working group on rural housing (2011) has estimated shortage of 40 mn houses in rural area which are also largely lower income families.
The future challenges in housing are; firstly, how to make the houses affordable to EWS when cost of construction is kept high by private developers especially with brand stone/tile flooring, fittings, fixers,etc on the skyrocketing prices of urban land. Secondly, the challenge is how to make the houses accessible to the EWS without routing through the speculators in real estate. It is a widely held view that a large number of houses constructed in recent years are either unsold or lying unused with the speculators. Housing, being a basic necessity, government has to abolish speculation with use of the Pan/adhaar card with every exiting ownership and new purchase of house. If, we recollect the PURA (Providing Urban facilities in rural areas) model of exformer -President APJ Kalam (which was left to die its own death) then its slightly modified form can be much relevant in making houses affordable and accessible to EWS. A model of housing similar to PURA is being implemented by the Republic of Uzbekistan is developing housing colonies near their bigger rural settlements with affordable cost of construction and providing a community centre, a good play ground, transport and internet facilities within the colony and ensuring educational and health facilities in nearby areas. The cost was almost half as compared to comparable houses of India. As discussed by the author during his recent visit, the houses are allotted to the families of that area especially teachers, para- medical employees, drivers, army, police etc. Allotment is made to those who can give 30 % down payment and the remaining part is arranged as bank loan @ 7% repayable in 15 years. The allottees are not allowed to sell their houses for 15 years. This model is not only ensuring affordable houses to the actual users but also checking influx of rural population to urban areas.
Conclusions
The contribution of housing & construction sector in the GDP of India has almost doubled during 2000-2011 with synchronisation in growth rates of the two to a large extent. The modern housing in India has mainly been confined to urban areas due to much higher growth rate of urban population especially singular families. The policy changes since 1998 especially rebate in income tax on the interest & principal repayment, liberal terms & conditions of housing loan, enhanced depreciation rate to corporate for employees houses have given a big boost to bank finance during 2000-12. The comparison between the annual growth rates of housing loans from SCBs and GDP clearly depicts the former may be one of the pull factors for the growth of the economy during the period 2000 to 2012.
But this impressive growth of housing sector through housing loans has excluded EWS and those working in unorganised sectors due to lack of security with them while the upper and middle classes are taking undue advantage of loans and purchasing houses for speculative purpose. This process has increased the prices of housing in view of expected high prices and it has made the houses inaccessible to weaker sections. That may be reason that in the requirement of 18.7 mn house during 2012-17, 18. 5 million is for EWS/LIG. The PURA model with some modifications on-lines international experience is suggested as an approach to make houses affordable and accessible to EWS.
The author is at present serving as Professor, SBI Chair. Earlier he served in National Bank for Agriculture and Rural Development in eight states of India like Bihar, UP, Uttrakhand,, Punjab, Haryana , Arunachal, Maharashtra, Delhi in various capacities and retirted as General Manager
|