|
|
Growth and Development Dynamics
of Indian States: A Comparison
Dr. Sanjay Tiwari
The growth story of India during the last two decades has been exhilarating barring a period of economic slowdown which persisted from 2008-10. The inclusive growth model-adopted by the government during the 11th Plan strives for educational, financial, technological and political inclusion of masses which are being termed as ‘demographic dividend’ by economists of the world-may take the credit for persistent growth of Indian economy even in the global slowdown phase. The emergence of civil society and NGOs during the recent past and the passage of important bills like Food Security, RTI, RTE and Pension Funds Regulatory Authority bills are live manifestation of inclusive growth philosophy of the government at centre. Some states are growing but not developing as far as other social parameters are concerned while others may not seem to be growing but on parallel have good governance. There is a need to compare and analyse the growth and development performance of the states and how governance has an impact on these variables.
The growth is measured in terms of Gross State Domestic Product (GSDP), state per capita income, industrial development, tax and revenue administration, investment, consumption while the parameters of development include; socio-economic indicators, health (Infant Mortality Rate-MR, Maternal Mortality Rate-MMR, Life Expectancy at birth), education (elementary, secondary and higher), infrastructure which consists of availability of potable water, usage of power, sanitation facility, road length per square kilo meter, housing infrastructure etc. Good governance is based on the principle that authority must be deployed and even necessarily based on a larger purpose – the good of the people being governed. On the other hand governance is related to the designing, monitoring, assessing and evaluating the systems of delivery of services and the fulcrum around which governance revolves is planning and implementation of economic policies for equitable distribution of resources to the public at large. The returns of growth can be realised provided there is consonance in the policies and good governance practices adopted by states. The performance of states in terms of economic growth and development is decided by the structure and practice of governance prevailing in these states. There are three dimensions of governance i.e. legislative, judicial and executive. However, generally the executive part is much talked about. A comparison of performance of states on growth and development measuring variables reveals that the states which are fastest growing like Bihar, Jharkhand and Gujarat, Punjab also have ‘governance deficit’ as revealed by various reports, studies and empirical evidence. Now the basic question remains to be answered is that “Does good governance also lead to growth and development or growth and development are governance neutral?”
INDIAN STATES : GROWTH AND DEVELOPMENT
An analysis of growth performance of Indian states measured as percentage in Gross State Domestic Product (GDP) reveals that during 2005-06 to 2011-12 the states like Arunachal Pradesh, Bihar, Chhattisgarh, Gujarat, Karnataka, Maharashtra, Uttarakhand, Orissa, Haryana has been satisfactory (table1). The growth rate in industrial sector in the states like Andhra Pradesh, Bihar, Chhattisgarh, Gujarat, NE states, Punjab, Orissa is above the national growth in this sector particularly during later five years period. As far as growth in service sector is concerned all states have shown growth rate touching and even crossing the national average during the last five years which may be termed as service led economic growth. The growth in agriculture and allied sectors is exceptionally higher as seen in Bihar, Maharashtra, Jharkhand, Chattisgarh, Rajasthan, Gujarat and in North Eastern states like Mizoram, Tripura while in states like Haryana, MP, Himachal Pradesh the agriculture and allied sector has grown moderately. The states like Punjab, UP, Uttarakhand, West Bengal are sluggish in agricultural growth and Kerala has shown negative growth during the period 2005-05 to 2011-12 (Table 1).
An analysis of two outcomes of growth i.e. employment generation and poverty alleviation shows that though the share of employment in agriculture sector has decreased during the period from 2004-05 to 2010-11 in the states like Andhra Pradesh, Bihar, Chhattisgarh, Karnataka, Assam, Himachal Pradesh, Maharashtra, Odisha, Uttar Pradesh, Gujarat, UP and Uttarakhand-agriculture sector continues to be the major employer despite lower growth rates. The percentage share of employment in agriculture sector in the states like Assam, Chhattisgarh, Gujarat, Haryana, Bihar, Jharkhand and Rajasthan has decreased substantially while in Himachal Pradesh, Maharashtra and MP the share has gone up during the period under observation (table 2). Other states have shown moderate decline in the share of employment in agriculture sector. But it is obvious from the data that the share of employment in agriculture is compensated by the generation of employment in service sector in almost all states.
DOES GROWTH LEADS TO POVERTY ALLEVIATION?
The biggest question before the policy makers today is that “Has growth benefits percolated down to the masses and have the Central Schemes led to poverty alleviation?” If we look at the figures of people below poverty line, it is clear from the (table 3) that whatever methodology is adopted (Lakadwala or Tendulkar) the number of people from below poverty line is declining. The latest data released by Planning Commission which is based on Tendulkar Methodology reveals that sharp decline in population below poverty line is observed in the states like Bihar, Odisha, Uttarakhnad, Gujrat, Goa, Tripura, Himachal Pradesh, West Bengal, Karnataka, Kerala, MP, Haryana and Maharashtra during the period 2004-05 to 2011-12 (Table 3). Surprisingly, in Arunachal Pradesh and Mizoram poverty has increased during the period. In the states of Chhattisgarh, Bihar, Jharkhand, UP, Odisha, MP and Manipur the population below poverty line is around 30 percent, while it is less than 10 percent in the states like Andhra Pradesh, Delhi, Goa, Himachal Pradesh, Kerala, Puduchchery and Punjab. In Rajasthan, Uttarakhand, Haryana and West Bengal moderate level of poverty still remains (Table 3).
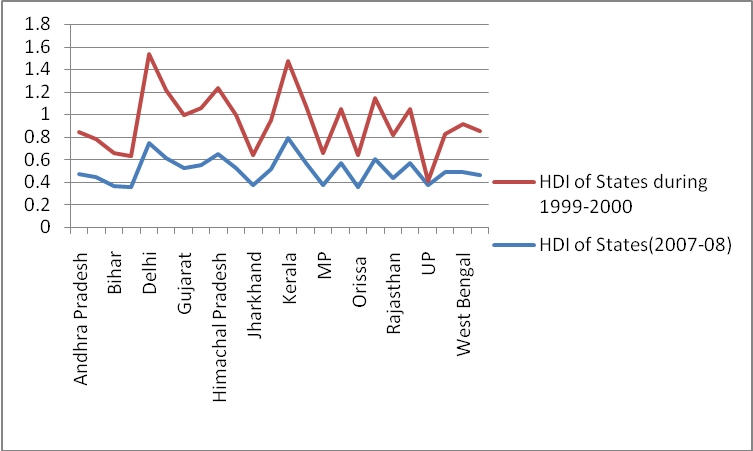
A comparative analysis of development indicators among states shows that Kerala, Karnataka, Delhi, Goa, Gujarat, Haryana, Himachal, J&K and Punjab are leading and UP, Bihar, Jharkhand, Chhattisgarh, Bihar, MP, Orissa, Andhra Pradesh and Assam the development has been low during the period 1999-2000 to 2007-08 as compared to other states (Table 4).
There exists a state-wide disparity in human development indicators like education and health as revealed in Twelfth Plan (2012-13) draft document. The overall literacy rate and particularly female literacy rate is lower i.e. less than 70 percent during 2011 in the states like Andhra Pradesh, Assam, Bihar, Jharkhand, Haryana, Karnataka, MP, Chhattisgarh, Odisha, Rajasthan and UP(Table 5). In terms of health the IMR in 2009 was less in Kerala, Tamil Nadu, West Bengal, Karnataka, Maharashtra and Punjab which have higher female literacy rate and in the states of Bihar, Jharkhand, Andhra Pradesh, MP, Chhattisgarh, Odisha, Rajasthan and UP the IMR is found to be higher as their female literacy is lower. It can be conclude that female literacy is an important factor to determine the health of the people of a state (Table 5).
Pranjul Bhandari (2012) in her study ranked the states on the basis of three indicators-health, education and infrastructure and concluded that– Himachal Pradesh, Kerala, Orissa, Tamil Nadu and Bihar have been the best performers across all the three sectors. West Bengal and Chattisgarh have also been amongst the best off states. Laggard states are–Uttarakhand, Rajasthan, J&K and Jharkhand across all the three sectors while the remaining middle ranking states have varied performance. Goa, Punjab and Karnataka have done well in health and infrastructure, but underperformed in education. On the other hand, Haryana, Andhra Pradesh, Gujarat, Assam, MP, UP and Maharashtra have each underperformed in two of the three sectors (Table 6).
Figure 1: Comparative Human Development Index of States (1999-2000 to 2007-08)
GOVERNANCE : PERFORMANCE OF STATES
In a study by PHDCCI (2011) it is observed that “The competitiveness report ranked states according to several parameters like Economic Strength, Business Efficiency, Governance Quality, Human Resources and Infrastructure. Delhi performed the best in these indicators followed by Punjab, HP and Uttarakhand. J&K ranked lowest preceded by UP and Rajasthan.”
The comparison of states in terms of delivery of services to their masses has been done by Desai et al (2010) in which an analysis of the access to the Social Safety Programme reveals that states like Bihar, Jharkhand, Chhattisgarh, NE, Andhra, Karnataka, Odisha and MP are still below the national level as far as number of cardholders are concerned while the condition of states in terms of beneficiaries of rice and wheat at PDS is found below national level in the states such as Haryana, UP, Delhi, Bihar, Jharkhand, Rajasthan, MP, Chhattisgarh, NE, Assam, West Bengal, Gujarat and AP (Table 7). In terms of old age pension penetration Haryana is leading followed by Himachal, Bihar, Chhattisgarh, NE, Odisha and Andhra Pradesh (Table 7). Recently the Ministry of human Resource Development (MHRD) has found that several state governments have failed to act on complaints about inedible meals making children ill, mismanagement, misappropriation of funds and corruption in the flagship Mid Day Meal Scheme (MDMS) during the period from 2011 to July 19, 2013. UP, Bihar, Haryana, MP, West Bengal, Delhi, Jharkhand and Punjab are the states where the complaints are higher (The Indian Express, July 30, 2013).
As observed in various studies corruption measures the degree of governance. A study by Transparency International based on the analysis of data from 2006-10 ranks the states according to anti corruption efforts made by the state governments and the least corrupt states are; Bihar (0.88), Gujarat (0.69), Andhra Pradesh (0.61), Punjab (0.60), J & K (0.40), Haryana (0.37), Himachal (0.35), Tamil Nadu (0.29) and Karnataka (0.29).
Debroy et al (2011) developed an index called economic freedom index which reflects the economic governance of states and is based on three parameters such as size of the government, legal structure and security of property rights, and regulation of business and labour. States in India which are economically more free are also doing better in terms of a higher per capita growth for its citizens, unemployment levels are lower in these states, sanitary conditions are better and the states also attract more investments. During 2009 Tamil Nadu, Gujarat, Andhra, Haryana, Himachal, MP and Rajasthan were among the states having EFI values above 0.40, Jharkhand, J & K, Kerala, Maharashtra, Punjab, Karnataka, UP, West Bengal, Chhattisgarh and Odisha have moderate value of EDI above 0.30 and the lowest index was for the states like Assam, Uttarakhand and Bihar(Debroy et al 2011).
Law and order is the prerequisite for governance and according to National Crimes Record Bureau the incidence of crimes against women during 2011 were higher in states such as West Bengal, Andhra, UP, Rajasthan, MP, Maharashtra, Assam, Kerala and Gujarat. As far as percentage incidence of cognizable crimes (IPC) is concerned, Andhra, Kerala, MP, Tamil Nadu, UP, Rajasthan, West Bengal, Karnataka, Gujarat and Bihar are leading states.
Mundle et al (2012) in their study on quality of governance among states found that good governance is not only correlated with the level of development but also the rate of growth. There appears to be a positive relationship between rates of growth and the quality of governance rank, i.e., the better the quality of governance, the higher the growth rate. Applying three analyses i.e. PCA, Modified Borda scores and Average of averages methods they concluded that six states between them occupy the first five ranks in all three methods: Andhra Pradesh, Gujarat, Haryana, Kerala, Punjab, and Tamil Nadu. Similarly, at the lower end seven States among them account for the bottom five ranks in all the three methods: Assam, Bihar, Jharkhand, Madhya Pradesh, Uttar Pradesh, and West Bengal. Bihar is distinct among states with a very high growth rate relative to its weak governance ranking. The pattern is similar for other states like Gujarat and Maharashtra. Conversely, there are States like Punjab and Kerala, where the growth rates are unusually low for their governance ranking.
CONCLUSION
From the discussion above it is proved that growth leads to development and governance is the equitable distribution of growth benefits to the masses. Governance is in fact affected by the degree with which state governments utilize, manage and control the welfare schemes launched by central or state governments. In some studies it is also observed that growing states are facing ‘governance deficit’ and to analyse governance from different perspectives it would be pertinent to apply disaggregated analysis. The policy framing for inclusive growth is the agenda of the centre while the onus of responsibility lies on the states which are supposed to implement the centrally sponsored schemes. The states which are enjoying more economic freedom to take decisions is doing well on all three fronts i.e. growth, governance and development. Stability of government is also a big factor which is responsible for growth, development and governance. The situation of law and order also has an impact on the governance. The backwardness of Jharkhand, Chhattisgarh, West Bengal, Odisha and MP is mostly due this reason. Kerala has performed well on development front but the slow growth rate is going to hamper the development in future and law and order is also not up-to the mark. Gujarat has emerged as a high performer state but this is mainly attributed to urbanization while in rural areas the state is facing ‘development deficit’ which in future may not lead to sustain growth. Corruption is also one of the factors responsible for the governance failure. The implementation of schemes for social welfare is the responsibility of states but petty politics of distribution of resources and coalition governments create hindrance in the development and equitable growth. Hence, for achieving inclusive growth the states should improve their governance first and then ensure and develop a monitoring mechanism so that the distribution of resources is done in equitable manner.
Dr. Sanjay Tiwari : (stiwarigju@rediffmail.com Mob: 09416628481) is Associate Professor in the Deptt. of Management Studies, School of Law, Governance, Public Policy & Management Central University of Haryana, Mahendergarh.
|